How to Test for Insulin Resistance: Your Comprehensive Guide
Signs and Symptoms of Insulin Resistance
- Increased Abdominal Circumference
- Easy Weight Gain
- Difficult Weight Loss
- PCOS – here are 14 signs you might have PCOS
- Acanthosis Nigricans (dark velvety skin behind the neck or under the arms)
- Skin Tags
- Fatty Liver
Why are so many patients with these clear signs and symptoms of insulin resistance testing negative for the most common assays for diabetes?
The answer is simple! The wrong tests are being recommended.
What’s the Difference Between Diabetes and Insulin Resistance?
Rather than a condition that develops overnight, the onset of type two diabetes is a lengthy process that takes many, many years to manifest. It begins with insulin resistance, often starting decades before the high blood sugar levels characteristic of a diabetic emerge.
Insulin resistance is characterized by hyperinsulinemia – the secretion of higher than normal amounts of insulin either after eating, or continuously even when fasting. Insulin is an important hormone – without which we would quickly die. It is released after we eat, and tells our bodies what to do with the energy we consume. Insulin directs glucose into storage within our cells and blocks the breakdown of fat since there is already abundant energy in the bloodstream after a meal. This natural, healthy process can go wrong through genetic susceptibility or if we gain significant weight.
As cells accumulate excess energy or through predisposing genetic factors, they become less sensitive to insulin’s message. The pancreas must then produce increased amounts of insulin in order to manage blood sugar effectively. Unfortunately, we can secrete high amounts of insulin and have quite normal blood glucose for some time – this is because increased levels of insulin can “work overtime” keeping the blood sugar from climbing too high. Unfortunately, having unusually high amounts of insulin after eating, or when fasting does have negative health impacts on our metabolism, hormones and cardiovascular systems.
How To Test for Insulin Resistance or Hyperinsulinemia
First, here are the most commonly completed tests for metabolic health, many of which will not pick up insulin resistance. That said, it’s important to understand the background when you want to understand which tests to request and why.
Fasting Glucose
A simple test of blood sugar measured after an overnight fast, this is a measure particularly good at picking up diabetes. Levels above 5.5 mmol/L (99 mg/dl) indicate a higher chance of diabetes. There are however many, many individuals with normal fasting glucose who have significant insulin resistance and pre-diabetes.
HBA1C
This blood test approximates your average blood sugar for the past 2-3 months, meaning it does provide us with some good information on glucose control. It measures the percentage of blood sugar attached to hemoglobin (the protein which carries oxygen in your blood cells). The higher your blood sugar levels on average, the more hemoglobin you’ll have with sugar attached to it. An HBA1C between 5.6 and 6.4 indicates pre-diabetes. Above 6.5 indicates likely diabetes. It is important to note that patients with iron deficiency anemia can have falsely elevated HBA1C levels.
Oral Glucose Tolerance Test
The Oral Glucose Tolerance Test is commonly prescribed to detect diabetes, yet again it will rarely be able to detect insulin resistance or hyperinsulinemia. For this test, patients fast overnight and then their fasting blood sugar is measured. A sugary liquid is consumed and blood sugar levels are then measured at intervals over the next two hours. Blood sugars less than 7.8 mmol/L (140 mg/dl)are considered normal. A reading of over 11.1 mmol/L (200 mg/dl) after two hours indicates diabetes. Between 7.8 mmol/L and 11 mmol/L suggest that a patient has pre-diabetes. Many patients with insulin resistance will have completely normal glucose tolerance tests and passing this test does not mean your metabolism is healthy!
As previously mentioned, the majority of those who have metabolic problems and insulin resistance will test within the normal range for all of the above markers.
In PCOS, a condition where high levels of insulin cause the ovarian theca cells to release high levels of testosterone and other androgenic hormones, it is helpful to know the degree to which hyperinsulinemia is present. Often, women with PCOS have completely normal blood sugar levels, and can often have low blood sugar levels as well. Yet, their metabolisms may be significantly impaired.
Fasting Insulin
Fasting insulin is a relatively inexpensive and easily accessed test but unfortunately, it is not often ordered by physicians. Patients with moderate or severe insulin resistance will often have an elevated fasting insulin level.
According to the NHANES III Survey, the average insulin level in the U.S. is much lower – is 8.8 uIU/mL for men and 8.4 for women(Maureen I. Harris et al., 2002).
Although fasting insulin is a good screening test for severe insulin resistance, it is often not enough to pick up moderate or mild insulin resistance. As we will see through the work of Dr. Joseph Kraft, a pioneer in the development of insulin assays, many people with normal fasting insulin and exhibit comparatively high insulin responses after eating.
HOMA2 (Homa-IR)
The Homa2 is a mathematical calculation based on the ratio between fasting insulin and fasting glucose. It is able to give an approximation of insulin resistance as well as pancreatic beta cell function (which is often impaired as type two diabetes begins to develop). The HOMA2 correlates well with the euglycemic clamp method which is a tested research method to determine insulin resistance (and which is not practical for clinical use).
Information required to calculate HOMA2:
- Fasting glucose
- Fasting insulin
- HOMA Calculator (available here)
Normal values: are often under 1.5 for very metabolically healthy individuals. Mild insulin resistance may result in levels between 1.5-2.0. The higher the number the more insulin resistance.
C-Peptide
C peptide is a molecule that can reflect endogenous production of insulin as it is linked to insulin when it is first produced. C- peptide is not often tested except in those suspected of having type 1 diabetes however it can also be a surrogate marker of insulin resistance as levels can be higher than normal.
Normal values (fasting) : range from 0.51 – 2.72 ng/mL
Triglycerides
Of the lipid panel, triglycerides tend to be the most specific marker of insulin resistance. A common cause of high triglycerides is excessive consumption of carbohydrates, particularly refined carbohydrates and sugars. When the liver has sufficient energy stored in the form of glycogen (carbohydrate) any additional glucose is shunted into the production of fatty acids which fat cells use to synthesize triglycerides. As such, triglycerides can be raised from overconsumption of energy (calories) and of carbohydrates. As insulin also inhibits the breakdown of triglycerides from fat cells, insulin resistance is linked with the accumulation of triglycerides in fat cells.
Normal values:
- Normal — Less than 150 milligrams per deciliter (mg/dL), or less than 1.7 millimoles per liter (mmol/L)
- Borderline high — 150 to 199 mg/dL (1.8 to 2.2 mmol/L)
- High — 200 to 499 mg/dL (2.3 to 5.6 mmol/L)
- Very high — 500 mg/dL or above (5.7 mmol/L or above)
The Best Test for Insulin Resistance: Insulin Assay with Oral Glucose Tolerance Test
By far, the most valuable test for insulin resistance, hyperinsulinemia and other blood sugar dysregulations is the Insulin Assay with Oral Glucose Tolerance test.
We frequently order this test for our clinic patients (we call it the Insulin Glucose Challenge in our practice). In typical medical practices, this test is rarely completed yet it can provide a great deal of insight into a person’s metabolic function for decades before diabetes develops.
Dr. Kraft was a pathologist who completed over 3000 autopsies, and incidentally found atherosclerosis in every person over 40 years of age, at which point he became quite interested in how this came to be. He found that the slow development of atherosclerosis was linked primarily to insulin resistance and hyperinsulinemia.

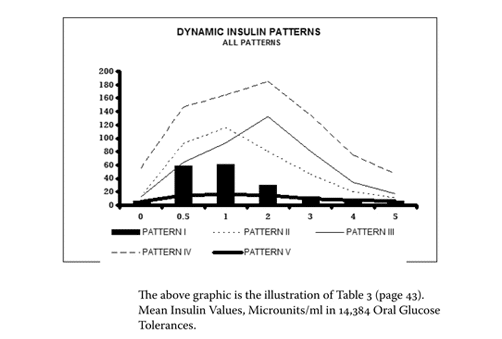
Dr. Joseph Kraft ran the insulin assay with oral glucose tolerance test on 14,384 patients and then compiled and published his groundbreaking results which we can use today to learn a great deal about our metabolic health.
How Does the Insulin Assay with Oral Glucose Tolerance Test Work?
In a similar manner to the oral glucose tolerance test, the patient fasts overnight and then completes fasting blood work. The main difference is that at each interval during the 2 or 4-hour span of the test, insulin is measured along with glucose.
This provides great insight into patterns of insulin resistance. Not only can the fasting levels be checked, but increases in insulin production when stimulated by glucose are easily seen.
Causes of low blood sugar can be understood as clear patterns of hyperinsulinemia and reactive hypoglycemia (severe drops in blood sugar 2-4 hours after eating) are picked up by this test.
In addition, a phenomenon called gastric dumping ( a cause of reactive hypoglycemia) can be determined through observing specific patterns in insulin release and glucose levels over the span of the test.
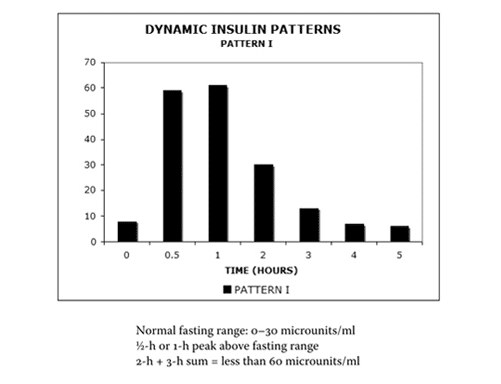
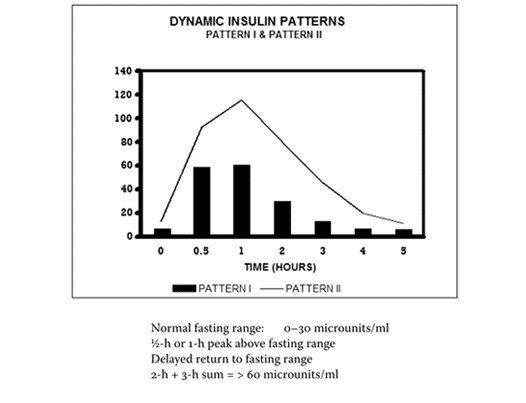
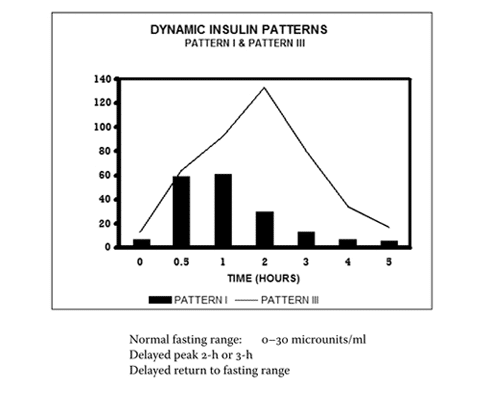
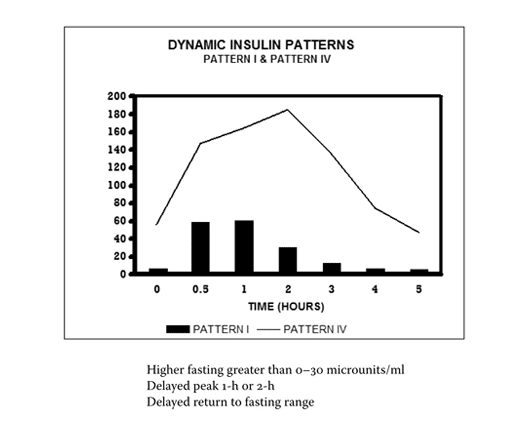
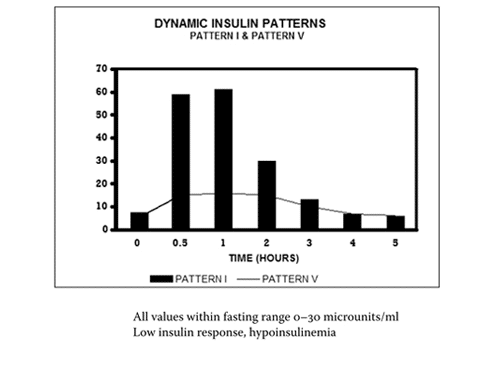
The 4 Stages of Insulin Resistance in Increasing Order of Severity on the Insulin Glucose Challenge Test
(Ref: J. R. Kraft, 2011)
Why are Tests for Insulin Resistance Important?
Knowing this information very important to your overall health and wellbeing. If prevention is your goal then these tests can be life-saving. If you have a condition aggravated by hyperinsulinemia such as reactive hypoglycemia, PCOS, or type two diabetes, these tests are key to managing your condition and reaching optimal health.
Consider that the very first effect of hyperinsulinemia is pathology of the arterial wall.As the arterial wall is an insulin-sensitive tissue, it has long been known that chronic exposure to high levels of insulin results in the development of lipid-filled lesions like those of early atherosclerosis. (Stout, 1979)
It is also well-known that in patients with diabetes, atherosclerosis is found in the vast majority of cases. It has been found that insulin has the capacity to stimulate the arterial muscle cell proliferation and lipid synthesis in the arterial wall, which is known as “endothelial dysfunction). Since arteries are present in all tissues in the body, we can see why diabetes causes such widespread changes to health, affecting almost every organ in the body. In fact, up to 80% of type two diabetics die from cardiovascular complications (Reasner, 2008). It is also known that retinopathy, which involves changes to the blood vessels in the eye develops at least 7 years before diabetes is clinically diagnosed(M I Harris, Klein, Welborn, & Knuiman, 1992).
Without the right testing, by the time diabetes is diagnosed, much damage has already been done. This is why the Insulin Assay with Glucose tolerance test is such an important component of a health care plan for anyone with metabolic health issues.
One of the early signs of hyperinsulinemia is what is known as functional or reactive hypoglycemia, a condition where the blood sugar plummets from 2-4 hours after eating. This condition is more common in women with PCOS(Mumm et al., 2016)
Back to the Basics – One More Test for Insulin Resistance
Waist to Height Ratio
A completely free yet accurate marker of insulin resistance is the waist to height ratio. This is incredibly simple to calculate as it is the waist circumference divided by height in the same units. A 2010 study following 11,000 subjects for 8 years found that WHtR was a better measure of the risk of heart attack, stroke or death(Schneider et al., 2010). Another study in 2016 followed 754 reproductive age women found that Waist to Height Ratio was a good predictor of Insulin Resistance and metabolic syndrome in women with and without PCOS(Behboudi-Gandevani, Ramezani Tehrani, Cheraghi, & Azizi, 2016).
Waist to height ratios over 0.5 are considered to be exceptionally risky when it comes to metabolic health. We encourage all patients to measure this ratio, as it is completely non-invasive and can be done at home.
I hope that this guide has been helpful for you in clarifying the difference between testing for insulin resistance and diabetes, two conditions that although are linked, require different testing to be done to detect. Have you ever been told that you were not insulin resistant even though you have clear signs and which tests have you had done so far?
Please share your experiences and cases below in the comments!
References
- Behboudi-Gandevani, S., Ramezani Tehrani, F., Cheraghi, L., & Azizi, F. (2016). Could “a body shape index” and “waist to height ratio” predict insulin resistance and metabolic syndrome in polycystic ovary syndrome? European Journal of Obstetrics & Gynecology and Reproductive Biology, 205, 110–114.
- Harris, M. I., Cowie, C. C., Gu, K., Francis, M. E., Flegal, K., & Eberhardt, M. S. (2002). Higher fasting insulin but lower fasting C-peptide levels in African-Americans in the US population. Diabetes/Metabolism Research and Reviews, 18(2), 149–155.
- Harris, M. I., Klein, R., Welborn, T. A., & Knuiman, M. W. (1992). Onset of NIDDM occurs at least 4-7 yr before clinical diagnosis. Diabetes Care, 15(7), 815–9.
- Kraft, J. R. (2011). Diabetes epidemic & you : should everyone be tested? Absolutely not! Only those concerned about their future. Trafford Publishing.
- Kraft, J. R. and K. T. S. (1993). Fasting Hyperinsulinemia: Diagnostic Parameters Applicable to Neurootological Equilibriometric and Related Metabolic Disorders (pp. 303–307). Linkoping: Proceedings of the NES, Volume XXI.
- Mumm, H., Altinok, M. L., Henriksen, J. E., Ravn, P., Glintborg, D., & Andersen, M. (2016). Prevalence and possible mechanisms of reactive hypoglycemia in polycystic ovary syndrome. Human Reproduction, 31(5), 1105–1112.
- Reasner, C. A. (2008). Reducing Cardiovascular Complications of Type 2 Diabetes by Targeting Multiple Risk Factors. Journal of Cardiovascular Pharmacology, 52(2), 136–144.
- Schneider, H. J., Friedrich, N., Klotsche, J., Pieper, L., Nauck, M., John, U., … Wittchen, H.-U. (2010). The Predictive Value of Different Measures of Obesity for Incident Cardiovascular Events and Mortality. The Journal of Clinical Endocrinology & Metabolism, 95(4), 1777–1785.
- Stout, R. W. (1979). Diabetes and atherosclerosis ? The role of insulin. Diabetologia, 16(3), 141–150.