Basal Body Temperature Charting for Fertility and Hormones
Have you ever wondered how to read your basal body temperature chart (BBT)? I almost always ask my acupuncture patients to complete a BBT chart when they come to my clinic because it is such a useful tool to understand many different aspects of hormonal balance and fertility. I am often asked by patients seeking fertility treatment, “Can you really tell all of that just by looking at the BBT chart?” and the answer is definitely –yes! You may know already that ovulation can be mapped from BBT charting, but did you know that learning to read your BBT chart can give you incredible information about different hormonal imbalances in your cycle and in your body as well? This article will go through the basics of reading BBT charts. To download a basal body temperature chart on which you can record your information please click below.
How to record your basal body temperature chart
Take your temperature on waking after at least 3 hours of sleep. Take your temperature immediately on waking, without getting up or moving about too much. Try to take your temperature at the same time each day as well, or your reading may not be accurate. If the time varies please make note of this, as well as any illness (cold, stomach ache) or interrupted sleep as this may affect the temperature readings you get.
If you look below, you will see an example of a BBT chart for what we would consider a typical cycle.
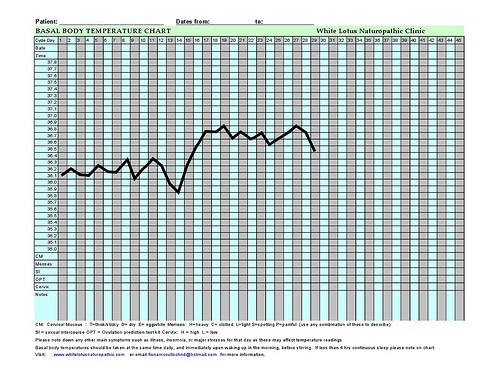
Phases of your chart
The first phase which you see is known as the Follicular Phase. This is the phase in which the follicles develop. Typically we like to see that this level is low and steady. Estrogen is the dominant hormone during this phase.
Around midcycle, you may or may not see a slight dip in temperature. Following this, you will see a strong rise in temperature of approximately 1 degree. The day before the temperature rises is the day you ovulate.
The second phase is known as the Luteal Phase. This is the phase in which the egg travels down the fallopian tube and the process of fertilization or implantation may occur. Typically we like to see that this phase is high and steady. Progesterone is the hormone which keeps the luteal phase at a high temperature. We also like to see that this phase is consistently around 14 days in length.
What do my readings mean?
Phase 1 - Follicular Phase - Low Temperature
When the follicular phase lasts too long, is too short, too high or low, or is unstable this can mean that there are hormonal imbalances which vary from thyroid conditions, to emotional stress. For example, emotional stresses often show up as an up and down movement of temperature from day to day.
The follicular phase tends to shorten as the ovarian reserve decreases, as follicles tend to go through premature recruitment and development in this case. If you have noticed that your preovulatory phase has been shortening consistently, check your ovarian reserve markers. Any of these changes can be normal in one given cycle, but if you notice that there are consistent changes, have your hormonal markers checked.
Conditions which affect Phase 1 readings
In thyroid disorders, we will tend to see an abnormally low or high temperature reading in this phase. In the case of stress, we tend to see instability of temperature, and in the case of primary hormonal imbalance we tend to see either an increase or decrease in length of this phase. In polycystic ovarian syndrome this phase can be longer than usual, indicating insulin resistance or excess androgens(male hormones). Insufficient nutritional elements and decreases in blood circulation to the uterus can also cause this phase to be abnormally long.
Phase 2 - Luteal Phase - Higher Temperatures
Midcycle, we see a spike in temperature, which is related to secretion of the hormone progesterone and is the result of ovulation. The temperature will rise the day after ovulation occurs. If you don’t see this spike, you may not have ovulated.
If the temperature reading in the second phase of the cycle (luteal phase) does not remain steady, your progesterone secretion may not be enough to maintain implantation and pregnancy. If the length of this phase is either too long or too short, this can indicate problems with the health of corpus luteum, or nutritional deficiencies (the corpus luteum is the outer part of the follicle left after you have ovulated, which continues to secrete the hormone progesterone allowing you to maintain pregnancy).
Temperature changes in Phase 2
If there is a downward decline occurring earlier than 12 days after ovulating, this suggests that there may not be sufficient progesterone production to maintain pregnancy. Implantation may occur 7 – 12 days after ovulation, in which case you may see an implantation dip on your chart. This is a normal and healthy finding, but like implantation bleeding it is also not necessary for a healthy pregnancy. There are many other more complex breakdowns of the variations in basal body temperature charting as well.
I find that looking at the basal body temperature chart of my patients allows me to pinpoint specific imbalances for each woman. Most unexplained infertility cases are actually not infertile at all, but are actually subfertile. Through looking at charts as well as lab results and symptoms, the cause can often be found. Charting can be an excellent tool for diagnostics especially in cases of unexplained infertility.
References for this article
- Lyttleton, Jane.(2004) Treatment of Infertility with Chinese Medicine. Churchill Livingstone
Hi, Thanks for sharing the article.I am on Chinese herbs for the past 10 months to resolve my infertility, I can see a improvement in my health, i finally started getting my periods naturally but still my bbt is not normal..I would need some help interpreting my bbt chart to pinpoint the actual imbalance i am facing, can i share my bbt for your advice?
Sure Swarna! We plan to offer a service for this soon since we’ve had many requests (we just opened comments on this thread today – it is our most popular webpage)…however until we get that service in place, please upload your bbt in the comment thread and I will take a look and comment.
Thanks Dr Fiona McCulloch !! Apologies for the delay. Here is my bbt ..I use to have a 23 day cycle about a year back but i stopped mensturating on my own and just now i started getting my periods again. Looking forward to your comments.
Hi Swarna,
There is definitely some instability in your temperature, which may reflect hypothalamic-pituitary gland dysregulation. Also, your progesterone doesn’t seem to be raising your temperature and keeping it in place, indicating a luteal phase defect. Going from this it does look like you ovulated. What I would be able to tell you once I saw when your period arrived is if you have a primary luteal phase defect (low progesterone) as the central issue, or if you are dealing with more of an egg quality concern and the resultant early ovulations that go along with that or another sex hormone imbalance in the follicular phase of your cycle. I could guess now, but I would know for certain when I see the full cycle. Another thing is that overall your temperatures seem very low. I would ask to have your thyroid looked at.
I hope that this was helpful! Good luck with your program!
Hi Dr Fiona, thanks for a detailed response..this is indeed very helpful..I would like to have a private discussion with you further , can I ask for your email address and also do you offer phone or online consultations to patients located remotely?
Feel free to use our contact form here and someone from the clinic will get back to you with more information!
https://www.whitelotusclinic.ca/contact/
Hi Dr. McCulloch! Very interesting article. I just started charting my bbt this month. Would you be willing to take a look at it?
Sure, post it and I will take a look at it!
Dr. F
Thank you so much!! I missed a few days in the beginning. And I think I woke up a few times in the middle of the night here and there. Maybe it’s way off. This is my first month charting. I had a cyst removed from my ovary 2 years ago that had endo in it. Put on continuous birth control for about a year and a half. Got pregnant as soon as we went off birth control and miscarried. Praying to get pregnant again.
Let me know if it sends
Hi Dr Fiona, sorry to trouble you..I just have couple of questions, I got my periods yesterday, so this time my cycle seems to be 25 days long..I am taking Thyroid meds already, and my thyroid seems to be normal.but my question is if i am having low progesterone,how many months would that take for my body to produce natural progesterone. I am taking a chinese herb called Yuan support formula from Golden flower herbs to increase my progesterone level. I am taking 3 tablets everyday. From my BBT chart, do you think my health issues can be solved naturally? I am losing hope at times :(
Here it is as of this morning
Thanks for posting! This is a short chart so I can’t tell too much about it….it looks as if you ovulated however, right around day 14! We will see if your temp stays up…if it doesn’t, your progesterone may be insufficient. You can post your full chart when you have completed it for more information. :)
Hi Dr. McCulloch, I’ve been charting my bbt for 3 months now (2 complete charts), I’ve been trying to get pregnant for 7 months, and had a m/c in March, would you take a look at my charts?
my first chart might not be accurate as I had a sore throat and a cold for two weeks, when the temperature spiked for the first chart, I think it was bc I had fever…
Hi there, yes – please post your chart!
Hello! I miscarried 2-3 months ago and am on my second cycle. This month my temperatures increased 2/10 degree on Day 15 and then upped again 10 days later by a larger jump. Before the miscarriage my periods had been 28-30 days. The chart is over daylight savings time change. Thoughts? Thanks for any help!
I posted my chart, but am not seeing it now. Please let me know if you can’t see it.
I can see it! It’s possible that you didn’t ovulate here until cycle day 23! Meaning it may take 12-14 days for your period to arrive after this. Sometimes having a miscarriage will throw things of even for a few months, until things regulate once again. Once you have your period we can look back and understand more.
Thank You!
Hi Dr. McCulloch, I have been monitoring my BBT now for one full cycle. My cycles are usually about 25 days long and I have started charting my BBT out of curiosity and simply to learn more about my body. According to my research, my luteal phase is short. Should I be concerned about my reproductive health or talk to my doctor? Though I am not planning for a family in the immediate future, I would like to have a child in the next three years. Days 26-28 in the graph are in my current cycle.
Thanks!
I forgot to mention that days 26-28 in the graph are in my current cycle.
Hi
this is my chart on ff, but i’m not sure if i ovulated this cycle. can you help me with interpretation please?
this is my chart
Hi I read your article, I am finding my chart this month is weird im unsure I ovulated…i am cd 27, I believe 8dpo, I will post my chart could you let me know your thoughts? Thank you kindly!
My chart
Hi this is my chart, I read your article and found it helpful. I have only chartes 2 cycles, so reading and understanding it is new to me, I would appreciate any input please. I am 34 I have had 3 sucessful pregnancies, …3 healthy and happy sons…and sadly 1 miscarriage in May 14′. We are ttc our rainbow baby! Thank you kindly.
Hi Dr. McCulloch I was hoping you would please look at my chart. I dont know how to read it. It is only my 2 cycle charting. I am 34 & have 3 sons….sadly in May we lost our 4th. We are ttc our rainbow, any advice or comments are much appreciated. Thank you very much.
Yes it looks like you ovulated around day 24!
Hi, ive been trying to get pregnant for 2.5 years and have recently had all the tests via a consultant who classes me an unexplained. A friend recommended bbt charts. I am 41 and never had a scare of any kind. I was on the pill for 20 years due to horrible periods. Could bbt charts help me as i feel my clock is ticking louder than ever and can’t get any help??m
Hi Sam,
I do think they may help. They are particularly helpful for unexplained cases. By the way, I don’t believe in unexplained infertility. There is always a reason. Try the charting, but also get the testing for your ovarian reserve (AMH), endometriosis (laparoscopy) and comprehensive testing for the thyroid and PCOS. The BBT can help to get a view of your ovulatory patterns and hormonal imbalances – in a way that gives you much more information than the snapshot you get from hormonal testing on a single cycle day. All taken together, you should be able to learn quite a bit.
I hope that this helps! Happy 2015 and best of luck for this year for you!
Hi Keli,
It looks like you have a very short luteal phase here. Also you are ovulating later on in the cycle. I would ask to have your prolactin tested…and also look for signs of PCOS. Your progesterone may not be sufficient and I would test that it early pregnancy.
Thank you!
Dr. Fiona
Hi Dr McCulloch,
Many thanks for your response.
The consultant i am under is very poor, she didn’t read my notes and missed a test, couldn’t explain the results and as I am in the York area told me there is nothing she could do. She told me to ‘Google’ unexplained infertility’ and move house. Obviously, I was devastated at not getting any answers at all and having nowhere to go. I am 41 and extremely stressed from all the tests, the last one caused considerable pain and horrendous periods since, it has been 4 months and am having to sleep on towels when menstruating. I have made another appointment to see my gp so your advice is very helpful.
Thanks again
attached is 1.5 months of cycle tracking and it seems i’m all out of wack as the BBT is very unstable. My husband and i live in australia, i am 31 & he is 32 and we are both a healthy BMI and we have a 3 year old daughter that was conceived naturally and had a natural birth. We have since been TTC for 2 years with only a “successful pregnancy” ending in early miscarriage at around 6-7 weeks. i have completed a day 21 progesterone test which showed ovulation, this month my HyCoSy came back showing a healthy uterus, clear tubes & good ovaries with 6 eggs maturing in one ovary & 8 eggs maturing in the other at cycle day 8, my husband semen analysis was good, so to date it seems to be unexplained fertility but from charting it looks like something is out! I’d love to know what your suggestions are?? Thanks in advance :)
hi dr. fiona the first half of my cycle was stable but the second half their was a definate rise then dropped by a whole degree and keeps doing that every other day have i even ovulated
Hi dr fiona, i have posted below but haven’t received a response yet so thought i would add a second full month of charting
attached is 1 months of cycle tracking and it seems i’m all out of wack as the BBT is very unstable. My husband and i live in australia, i am 31 & he is 33 and we are both a healthy BMI and we have a 3 year old daughter that was conceived naturally and had a natural birth. We have since been TTC for 2 years with only a “successful pregnancy” ending in early miscarriage at around 6-7 weeks. my cycle has increased from around 23/24 days to now a 26/27 day cycle and last month i did ovulation tests and did not detect a LH surge. i have completed a day 21 progesterone test twice but results were 17 & 24 which i wonder if that is high enough to sustain a pregnancy, this month my HyCoSy came back showing a healthy uterus, clear tubes & good ovaries with 6 eggs maturing in one ovary & 8 eggs maturing in the other at cycle day 8 and my AMH was 9, my husband semen analysis was good, so to date it seems to be unexplained fertility but from charting it looks like something is out! for quite some time i have been feeling extremely light headed like i could pass out, and foggy in the back of my head and finding it hard to concentrate, fatigued, low libido, recently started having allergies to flowers when i never have in my life, also having night sweats and being far more emotional than i usually am yet every time i see a doctor about this they do blood tests and give no answers.
I’d love to know what your suggestions are?? Thanks in advance :)
Hello. Could you look at my chart please? We’ve lost three babies and it took two years between the first two and the third to finally get pregnant. My third went all the way until my 5th month and then my baby’s cord got twisted some how. Now, it’s been almost 5 months and we can’t seem to get pregnant again. I think I ovulated on the 17th. Is that right? After that, I’m not sure. Thank you !
When was your day 1? Thanks…and so sorry to hear of your loss. :(
HI Sam,
BBT charting is a great way to learn about your cycles! For some people it can be stressful but for others it is empowering. If you had horribly painful periods it may be a good idea to be checked for endometriosis via laparoscopy.
Thanks very much,
Fiona
HI Carrie,
I would ask to have your thyroid checked. It’s also possible you have a luteal phase defect and low progesterone.
with thanks,
Hi there,
It’s rather hard to say just from the chart exactly what is going on here, but it certainly does look like there is some serious hormonal dysregulation happening. Perhaps an adrenal, thyroid or autoimmune condition, especially with the erratic temp in the beginning of your cycle. Your temp also took awhile to drop at the start of your cycle which suggests that perhaps some hormones may may not be going to baseline at the right time.
Thank you. It was January 2, but I didn’t start charting until January 13th. I’ve since started a new chart.
Hello. I’m new to this site and new to temping. Im 22 and my husband is 23 and we have been trying to concieve for over a year now. I was wondering if you could take a look at my chart for last month and this month and let me know what you think. ( if I’m ovulating or not and if so when) I’m just not quite sure how to read it is all. I have a clear blue fertility monitor which I have been using for about 5 months now but have never peaked only high readings. I’m not sure if its beacsue I’m not ovulating or because I’m 4’10 and weigh 87lbs.I have a very petite frame but I’m healthy and have a regular cycle every month. Well thanks so much for your input and advice would help :) Here’s my chart
what is considered a normal length of time for each phase? I have already been diagnosed with endo, IR, hashimotos, PCOS and both fallopian tubes were completely closed and had surgery to remove the damaged tube and reattach to healthy tube. I am currently taking synthroid everyday and have backed off from seeing a fertility doctor. I have started charting my bbt and i seen that you mentioned what could be the causes of abnormal phases but since ive already been diagnosed with basically anything a woman could have to make pregnancy almost impossible im just curious if my cycles are back on track yet. Im 27 and have never been pregnant.
Hi Dr. McCulloch, I have PCOS and have done IVF in the past for my twins. I am now TTC baby #3- hopefully naturally! I have been taking Pregnitude and started charting BBT. Do you mind looking at my chart? I needed Provera to start the cycle and honestly have no idea if/when I ovulated. Thank you!
Do u think I could be pregnant? Finding it hard to interpret my charts. Thanks
Hello Dr. McCulloch. I would appreciate if you can please take a look at my chart and provide me with your opinion. I am 28 and have never been pregnant. We have been trying for about six months. Might have possible PCOS, but my doctors are not all in agreement because I do not meet the clinical definition of PCOS (I only have high testosterone and suffer of insulin resistance). My usual cycles are about 30 days long. I used to keep track trough ovulation tests (always tested positive around day 16-17), and this is my first chart recording my BBT. Any comments, suggestions, and/or advice, is deeply appreciated. Thank you!
I tend to have a slow rise after ovulation, does this indicate an issue?
Hi Dr. McCulloch, I am charting after starting taking Prenatal Vitamins and it looks the most normal chart I have ever had. I was TTC last year and the temperatures where all over the place. I am charting and using OPK to track ovulation before we even try to get pregnant. I am confused since it looks like I got a positive on day that my temperature dropped the most, which I thought it was ovulation day when you chart. And I get usually these patterns in the cycles that look more normal than others, temperature drop (positive OPK) , then temperature small increases then it increases. Also, I dealt last year with the removal of a big bad fibroid, and I wondered if I could have low progesterone that is helping getting fibroids and also shorten my periods and crazt charting (could prenatal vitamins help with that?).
Hi Dr. McCulloch…. I was hoping you could have a look at my chart.. We are trying for our first baby and I am concerned by my low temps in the luteal phase… does this mean I am low in progesterone? Thanks so much :)
Hi Dr. McCulloch… I am concerned about my luteal phase temps being too low…. would love your thoughts on my chart I am a little lost on what to do. Thanks, Amanda
I’m not sure how to upload a picture on here but I was wondering if there is anyway someone could help me sherry my chart? Did it look promising?
My temps used to start low and rise after ovulation. Since my first son was born my temps start high drop midway and then go back up after ovulation. My chart isn’t complete just passed what I hope is ovulation. Can you look at my chart?
Hi,
Recently I’ve been getting dips below cover line on my chart.. Of course I was excited for implantation dip, last cycle I had two though and another this cycle.. Neither leading into pregnancy.. I’m on 100mg of progesterone… Is there a possible issue with my progesterone still? Please help.
Hi please could you look at my chart. This is an app I use to chart my bbt
I’m 25 and I have been trying just over 3 months and I just starting charting and I wasn’t sure when I ovulate.
My Ovulation Chart
Can you tell me how my charts looking?
Hello!
I’m getting really worried. I’m 24 y/o. Previously charted and had the usual temperature changes. But during this cycle I’ve had low temperatures every day. What might me happening?
Hey Dr. McCulloch Can you help me on this please how my chart look
Hello Dr. McCullough
Thank you for your article. Would you please take a look at my charts? I have 1 child, but I had 2 miscarriages over a period of 2 years before getting pregnant with her. We’re trying for baby number 2, and I am so worried that I will have issues getting and staying pregnant. I am.not sure what to make of my chart for this month. I have attached charts for both this month and the last.
Hi, I was wondering if you could look at my chart. I started charting on January 3rd. I have completely stopped nursing on November 2nd after 14 months, On January 30th, I had one day of light bleeding and spotting on the 31st. I took an ovulation test on January 19th showing surge. My BBT chart goes up and down quite frequently (and it did not appear to say up after January 19th and the bleeding started 10 days later). Is there a problem that I should get checked out?
I could not get the chart to post here, so here are my numbers:
1/3: 97.33; 1/4: 97.33; 1/5: 97.18; 1/6: 97.6; 1/7 :97.05; 1/8: 97.58; 1/9: 97.18; 1/10:97.18; 1/11: 97.6; 1/12:97.58; 1/13: 97.33; 1/14: 97.58; 1/15: 97.58; 1/16: 97.33; 1/17:97.18; 1/18: 97.58; 1/19: 97.86; 1/20: 97.6; 1/21: 97.9: 1/22: 98.04; 1/23: 97.9; 1/24: 97.9; 1/25: 98.48; 1/26:97.73: 1/27: 98.04; 1/28: 98.34: 1/29: 97.33; 1/30: 97.58; 1/31: 97.73
2/1: 97.18; 2/2: 97.45; 2/3: 97.33; 2/4: 97.05; 2/5: 96.8; 2/6: 97.45; 2/7: 97.86; 2/8: 97.86; 2/9: 97.45; 2/10:97.9:2/11: 97.58; 2/12: 97.45; 2/13: 97.18; 2/14: 97.86; 2/15: 97.33; 2/16: 97.33
Thanks for your help!
Hi Dr McCullouch, I am TTC since this cycle. I thought I ovulated on CD 16. Couple of days after ovulation I felt few changes in the body that I never felt before. But after 8 DPO there are no symptoms at all. I chart bbt early morning around 6 am everyday before getting out of bed. My cycles are regular and I am taking prenatal vitamins. Now I see that my temps are dipping which may lead to AF.. I don’t know why.. Can you pls review my chart and let me know your comments. Also how do I know that my progesterone level is sufficient or not. Please help me
Hi Dr Fiona, please could you have a look at my charts? I have been ttc for a year and have noticed that my temperatures seem quite high. Thank you!!
Hi Dr Fiona, please could you have a look at my charts? I have been ttc for a year and have noticed that my temperatures seem quite high. Thank you!!
Dear Doctor,
could you please look at my chart and tell me is that implantation dip @7dpo?
And am i having normal bbt chart?
Thank you very much.
P.s im new to charting bbt
Dr. McCulloch, can you please look at my chart? I started tracking this month. I’m now CD 31, 7 days late for my period and getting negatives on pregnancy tests. On Thursday 5/12 I had extreme cramps like I’ve never experienced before but no blood. Today I have very faint pink in my cervical mucus. Could it be still to early for a positive test? My BBT is still high, or is this normal? Thank you
This is my chart so far this month does it look like i ovulated couple of days ago.
I have been charting for 4 months and still can’t get pregnant. I only have my right ovary and endometriosis. Can you review my charts and tell me what you think is wrong?
Hi Dr. McCulloch , my husband and I are ttc our first baby. We have been physically together for 4 years and recently went to our first pre conception planning appointment. I have been charting for 2 cycles now, I’m currently on CD 16 and according to my ovulation tracker on day 4 of high fertility. I am also taking fertility blend 3x a day and using Conceive plus to help. I noticed my BBT spiked to 98.47 today but haven’t gotten my solid smiley face yet. Could this mean I’m not releasing an egg??? We want this baby so badly, just trying to understand. Any advice would be welcome.
Can you look at my chart? I’m very confused with the fluctuations in temp.
Can you please take a look at my chart? I’m confused by the temp fluctuations and it seems like no ovulation?
Hi Dr. McCulloch: This is my chart on Kindara. I am not sure if i ovulated this cycle. I had my +ve OPK on CD12. Can you help me with interpretation please? Is this considered a healthy chart? Thank you in advance. https://uploads.disquscdn.com/images/dc0a8e5f980458c915fb11cd74a1c5ee640d88b4b5edc07f93c62b255a4f3aee.jpg
Hi Dr McCulloch, I started plotting my basal temperature for this last month. When I calculated my menstrual cycle, i found that it lasts for 34/35 days. I predicted ovulation at day 21 of my cycle but my basal temperature is not inline with this calculation. Would you be able to help me analyse my chart as below and advcie when ovulation occured day 12-13 or 13-14?
https://uploads.disquscdn.com/images/a66223fb1da3d4524f59a8540b9b2c2bc360984ffc631a13b880108869b25b89.png
Hi Dr McCulloch, I started plotting my basal temperature for this last month. When I calculated my menstrual cycle, i found that it lasts for 34/35 days. I predicted ovulation at day 21 of my cycle but my basal temperature is not inline with this calculation. Would you be able to help me analyse my chart as below and advcie when ovulation occured day 12-13 or 13-14?
Hey I was hoping you could take a look at my chart. I’m kinda freaking out. last month I had a 9 day lp and this month I am on day 12 and the second day of temp drop. I woke up expecting AF both today and yesterday but nothing but globby white lotion type CM. I’m not really crampy but I’m achy like it feels very heavy and sore. I already have 2 wonder girls 8 and 3 so this is the first time my huby and I are having issues. https://uploads.disquscdn.com/images/4a8d40715d6ee14b6f92a12cb29abc9b43402ef9304b9c705b1718d673d46651.png
Hi Dr. McCulloch, I was wondering if you could help me interpret my chart. I have been charting since I got married in November but had to switch apps because I found the Ovia app worked better for me. I have uploaded 3 pictures of my chart from beginning of January. I am having nausea, headaches, slight cramping, a bit of vomiting, fatigue. sore and tender breasts and nipples, milky vaginal discharge, loss of appetite and increase of an appetite, and the sensation of being extremely hot and then cold. Based off my chart and symptoms, could I be pregnant this month? Thank you so much!
https://uploads.disquscdn.com/images/5038ae357ce87f0ec576f13da02fd5f66e75410010d12742890ce8cb045da04b.png https://uploads.disquscdn.com/images/1ea4cc823b1cc7e387f738ab65e44c1ef486217be3ea66129c4ed5465612eec0.png https://uploads.disquscdn.com/images/a6b24b1f11647944486dd113b5ea0c1e25fdf8eb39c483a0dfaa7a22cf4c2daf.png
can someone explain my chart? I have a second dip after ovulation https://uploads.disquscdn.com/images/2d8599359fd337cd2220912bbdd5966aa83e3ec425b9304c9088e09b2ca85b83.png
Can anyone help me figure out what day I ovulate? This is my first cycle tracking and the fluctuations in my temps are really confusing… https://uploads.disquscdn.com/images/2eebe15622eb2221dff1af01350da7ffef0574ae4247e232730ac1fa56f97860.png
Can you take a look at my chart please https://uploads.disquscdn.com/images/7a754ea3a67cb1e9f0c8a7eeb8bae64235c3097003839124b8a8ead26f7b2331.jpg
https://uploads.disquscdn.com/images/7bc99c9e234b3e4c1d67ee2b7d9dd2f04dee57e6ed0d7782ebd770b4702f5216.jpg Hi Dr. McCulloch,
My BBT chart is really wonky this month. The cycle is not complete, but I am have difficulty interpreting it. Did I ovulate around the 27th?
Thank you!
Hi,
I’ve just started charting my temperature to see if I am ovulating. I’ve used two different apps. One says I probably ovulated around day 12, the other at day 19. Day 19 doesn’t look right to me. Any advice?
Many thanks, L. https://uploads.disquscdn.com/images/be0ef04f4d2c9c5c3e17a3a72d8558b218e7d581191fd5621973f16f8bcf614f.png
Hi, are you taking your temp when you first wake up or waking up at the same time to take your temp?
It looks like you ovulated on CD 15
I see this was a month ago. Were you pregnant or did you start?
I was taking it as soon as i woke up but some times i couldn’t temp at the same time so maybe thats why my chart doesnt seem to show ovulation.. but since im now 5wk 3 days i guess i did :)
Could anyone help me figure out which day I ovulated on? https://uploads.disquscdn.com/images/54005c30c2bbf6969f0813578b6aaf2e5cae6eafeac567124fe8e0457451625a.jpg
Hi Dr. McCulloch, I would greatly appreciate any feedback you could give me on my charts. I have a 4 year old daughter and am now about 39. I got pregnant on my first try almost a year ago but had a miscarriage at 8w3d, despite 3 ultrasounds with proper growth and heartbeat (hcg drop and was slow to rise however). Since then, I have had 3 chemical pregnancies. I feel very strongly that I have some hormonal or other issue that is even clear to me, by my erratic charts. Thank you in advance, Autumn
PS- I included my miscarriage/CP charts and my healthy pregnancy with DD (the one with the green triphasic temp pattern) https://uploads.disquscdn.com/images/6397c9d48ca20ce98bad1b062f0f2c6c25c0c202809060be1c1ab83a8e6fc6bc.png https://uploads.disquscdn.com/images/285800e08d165120b972d2c0addc8cc9b26e29fbae272f2c757251b42921fd6a.png https://uploads.disquscdn.com/images/5d79516eda4d832a9332ccd0aba88575e2198245a2bd9e9452f37bf3e03929e2.png https://uploads.disquscdn.com/images/eab761d4a51141b92663dc85710609283ff7a933764f28edc3cf84f3f5e0b1e9.png https://uploads.disquscdn.com/images/f3563e4faf3bb473f4400cc8d9394f50f8bf581419eccd75627551525c4f0079.jpg
https://uploads.disquscdn.com/images/e5358dbbe9333463bab7b8f388432532e46385c6a486e33b5df663859f77ecf0.jpg
Hi Dr. McCulloch – I am new to charting and have had mixed reviews of my chart on Fertility Friend forums… what are your thoughts? I am an open mouth sleeper, taking temp orally, with a regular digital thermometer. If not pregnant, will begin new cycle with bbt thermometer and try vaginal temping.
Hi can u look at my chart Dr. MCULLOCH and tell me what u think I’m a 32 year old female trying to conceive baby #2 it’s been 6 years since I had my son https://uploads.disquscdn.com/images/6c9e319954c57da6d1c6a429c9902cfdf31581e8177e40556b2b2221ea7dbaea.png
I have no clue how to read my chart, could someone please help me understand this??
I have regular 26 day cycles. Inseminated with fresh sperm at home on April 12th, 2017 supposedly ovulation was between the 13th, 14th or 15th.
I had pink spotting in am on April 26th then a brown spotting at noon, then next day April 27th brown spotting and the last day just pink when i wiped and that was it. Was supposed to get my period on April 28th and it never came on cd 44 and no signs of period. Have had creamy white cm for awile now and high cervix.
I have a blood clotting disorder and have been giving myself shots to help keep my blood normal.
Any interpretation of my chart would really help.
Thank you https://uploads.disquscdn.com/images/ecee52f03666bb9d39f6873bfb606155bbcb89997d6e70199e443bae81c024aa.png
https://uploads.disquscdn.com/images/6f93f7f9bbd9996d4e6013f50207fe4ef04dc1806712104cce514d960b316588.png Hi, can you help me with my chart? I ttc for more than 3 years now
Dear Dr. McCullough, I am hoping you scan give me feedback in my charts. One is a chemical pregnancy (I have had 4 after a MC at 8w3d in one year). I have been tested for all the standard issues with recurrent pregnancy loss. I tested positive for one copy of the MTHFR and started folate instead of folic acid. Other than that, they have not found a reason. I was given progesterone but still had a chemical. My chart always seem to have readings too high in the follicular phase and too low in the luteal phase. My charts did not look like this when TTC my daughter. I feel like something is wrong but nobody can seem to tell me anything based on my charts. My estradiol level was over 50 at cycle day 3. I didn’t get a chance to test my progesterone because they put me on the suppositories and said it wasn’t necessary. Any help and insight would be greatly appreciated. Thank you kindly
https://uploads.disquscdn.com/images/97843d36ae3614c3437ed3044a6c9e616162ff1d111a63192665bdfd7fefffc2.png https://uploads.disquscdn.com/images/f37f9256e88e32e3101a33e8a88531a3b25fbd2f6da5bd552d01b8626bc03ac2.png
https://uploads.disquscdn.com/images/f0512aa16362017560d2605ea8651a87fb8da0be03a661e0c498b0773d13ebcb.png
Hello Dr. McCullough,
This is our first month ttc. I’m new at reading my chart. Can you please look at it. I’m not sure exactly what I am seeing
Hi. I’m confused as to what my chart means as today I did an opk and it was positive, but my temperature has stayed the same. Could you please look at my chart? Thanks.
https://uploads.disquscdn.com/images/a8cca56e96c63c34f857a2dd622c0ea1dd1cf9527d66ebc2720feb23071e9f94.png
Hi. I’m confused as to what my chart means as today I did an opk and it was positive, but my temperature has stayed the same. Could you please look at my chart? Thanks.
I haven’t been charting for too long…I am usually very regular–25 day cycles on average, ovulation mid-cycle, but here’s the deal: my bbt has dropped over a degree and has stayed low (97.5 degrees or so) for the last three days. I know I am not ovulating because I’m 3 days late for my period. My preggo tests up to date have been negative. Any ideas? We did try to conceive when I ovulated on August 18. We had sex for the two days before and then the day of and the day after ovulation. I just have milky discharge with no odor, sore boobs and mild nausea, and a late period. But, as I said, my tests have been negative up to present. Oh and today I have a headache. Fun. :)
Started from 23-26 days my temparature keep on dropping? May I know is it normal n what does it means to me? Anyway my menstrual cycle is 28 days.
can you help me interpret my chart please? https://uploads.disquscdn.com/images/d3edc449139e9f74720d6dc3b734d6b585644fb27233545a431ff26972e8ded2.jpg
Hello @dr Fiona McCulloch I really need help with my chart I did a opk and it was possitive on CD 14 does my chart look like I deffinatly ovulated as I herd opks can show a possitive but sometimes we may not release the egg is that correct ? Is my chart looking good I’m TTC https://uploads.disquscdn.com/images/4cd7c16268461d25aca1f4e33907a71b87da556e5afc7d6a654be29cbccf0171.png
Hi, can someone please help me out? What does this say? Please and thank you… Last month is a lot different than this month. https://uploads.disquscdn.com/images/4c6e8ca45388530cc961c23f8e513c410ddb00ee1130bfbc19efc23f309abaa1.jpg https://uploads.disquscdn.com/images/7078872709e9039c8a06319816d95d408b7de19b550d0f493a02d4a7eed29d35.jpg
Hi could you please take a look at my chart I haven noticed with all my charts the first phrase temps are always low and not sure about the whole chart I’m general your input would be greatly appreciated thank you https://uploads.disquscdn.com/images/03d22e7ed4811535c1b69e2e08e52e8393d25193071ac78da8746cfe2b7cc38b.png https://uploads.disquscdn.com/images/0e6c87aeafb1ee7070dd4a55c82c7d4bb2f7acf268f7bac477d609863990694b.png https://uploads.disquscdn.com/images/c0f4fdb57803b62d7ec651c14dbad873963a5e77614a56e4ff9be8e501ffa988.png
So it looks like you missed some days of charting. I use the Glow app, too, and it needs at least 9 consecutive days of charting to give you accurate info (like the coverline).
Can you look at my chart please https://uploads.disquscdn.com/images/fdfaaebef3d3f8a4ddb926e0161cf73638cffeef6dc108823adc5b23789dff76.png
Hi Dr. McCulloch,
I am hoping you could look at my chart. I am 38 years old and I have one daughter. We are tcc a second. Any advice or comments regarding my chart would be much appreciated.
Hi Dr. McCulloch,
I am hoping you could look at my chart. I am 38 years old and I have one daughter. We are ttc a second. Any advice or comments regarding my chart would be much appreciated. https://uploads.disquscdn.com/images/667ca97e822e4c6f0bb147a34768cff42c3e21e4ea7834c00c0f3ddc25ac423a.png